Interactive Map:
America’s Unconnected Students
For States Home | State Budget Calculator
Students are Being Asked to Work Remotely.
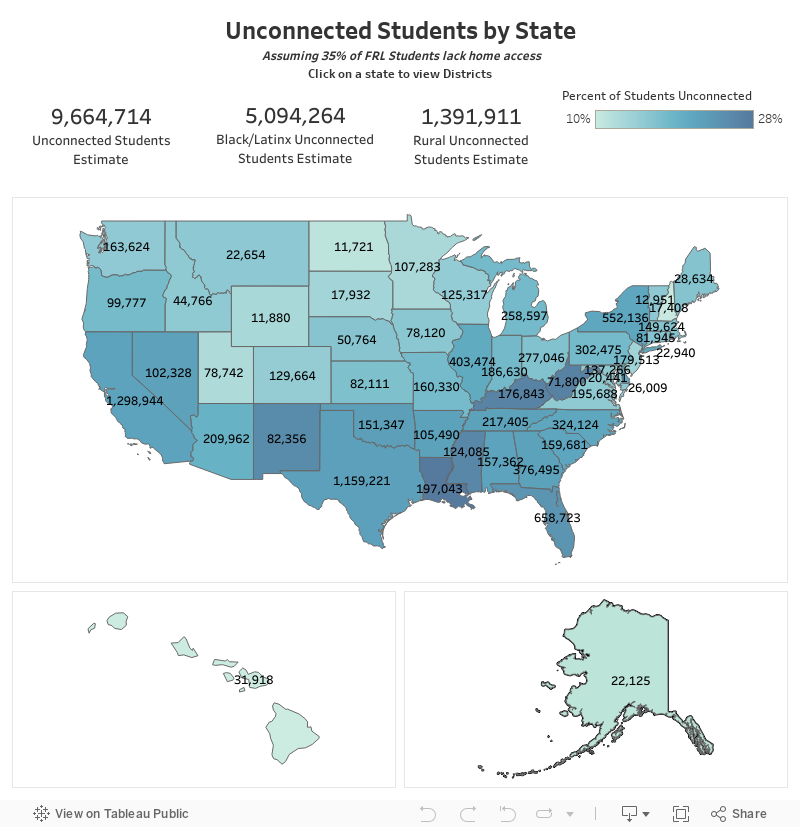
But 9.7 million don’t have reliable Internet at home.
COVID-19 has forced closures for virtually all of the nation’s K-12 schools. The ability to connect to online education at home has become critical to maintaining a continuity of learning during this crisis.
A Pew Research Center study estimates that roughly one-third (35%) of households with children ages 6 to 17 and an annual income below $30,000 a year do not have a high-speed internet connection at home. Assuming 35% of public school students who are eligible for free or reduced-price lunch lack Internet access outside the classroom, we estimate that 9.7 million students lack the connectivity necessary to continue their coursework at home during the pandemic.
Use the map below to apply our estimates by state, school district, and school.
ABOUT THIS MAP
This map uses a model designed to help estimate the number of unconnected students at each school.
The model provides an ESTIMATE and not a substitute for robust data collection and surveying at the local level to accurately assess the number of students without connectivity.
This model serves as a starting point to estimate the number of students who need internet connectivity. It is important to consider multiple models and data sources in assessing your school district’s needs and use them in line with intended policy and goals.
Some states have more precise data that show a higher or lower rate of connectivity. For example, see how North Dakota bridged the home access gap.
DATA SOURCES
Enrollment
The student count data for each school was obtained from NCES 2016-2017. With a few exceptions, ESH used USAC student counts if unavailable in NCES 2016-2017 or manually updated if alternate information was provided by a school district.
Free or Reduced-Price Lunch
School Free or Reduced-Priced Lunch (FRPL) data was obtained from USAC FY2019. For any missing values, NCES 2016 – 2017 data was used, and then if those were missing NCES 2015 – 2016 data was used. Any other missing values are extrapolated from school district-level FRPL percentages.
Locale Classification – Urban/Suburban/Town/Rural
School locale is determined using NCES 2016-2017 with the Locale Code, Urban-Centric field
- 11/12/13 – Urban
- 21/22/23 – Suburban
- 31/32/33 – Town
- 41/42/43 – Rural
OTHER MODELS
From 7 million homes to 17 million students, how do so many students lack access?
We compared the estimates of unconnected students from four organizations:
- EducationSuperhighway (ESH)
- Funds For Learning (FFL)
- Common Sense Media (CSM)
- Alliance for Excellent Education (All4Ed)
Each organization has conducted a study and provided estimates on the number of unconnected people and/or households in America, but the numbers range from 7 million homes to 17 million students. It is important to understand the questions and assumptions that each organization has made in producing these numbers.
To understand the differences in these estimates, here are things to consider:
- Units – What is the model measuring? Children, Students, Families, Households?
- Definitions – How do the researchers define the terms used? How is “internet connectivity” defined? How is “device access” defined?
- Assumptions – What are the assumptions that the researchers have made?
- Methodology – How are estimates calculated?
- Data source(s) – Where is the data coming from? How is this data collected?
While these models all provide great starting points to understand the scope and socioeconomic and racial inequities of the digital divide on students during COVID-19, the variability of these estimates underscores the importance of better data collection at the local and state level.
Table 1: National Estimates of “Unconnected”
| ESH | FFL | CSM | All4Ed | |
|---|---|---|---|---|
| 9.7 million students lack reliable internet connectivity at home | 7.15 million families without Internet access because they cannot afford it | 15 million to 16 million students without an internet connection or device adequate for distance learning | 16.9 million children lack the home internet access necessary to support online learning | |
| Units, Definition | “students” refers to K-12 students in public and charter schools | “families” refers to households | “students” refers to K-12 public school students | “children” refers to number of related children in the household |
| Definitions, Assumptions | “reliable internet connectivity” refers to internet connection adequate for distance learning | refers to families, households that do not have internet access because they cannot afford it | “internet connection” refers to internet provided via cable, fiber, or digital subscriber line (DSL) “Device” refers to desktop computer, laptop, or tablet | “internet connection” refers to internet provided via cable, fiber, or digital subscriber line (DSL) |
| Methodology | uses NCES and USAC for number of students, school Free or Reduced-Priced Lunch (FRPL) percentage, and multiplies it by 35% according to Pew study citation | cites number from GAO report that analyzed data from 2017 Census Bureau Current Population Survey (CPS) | uses NCES data for number of students and uses ACS for percent of individuals with or without at least one device in their household | number of related children in the household depending on income, race, and state |
| Data Source(s) | NCES, USAC, Pew Research Study | Government Accounting Office (GAO) Report July 2019 | American Community Survey (ACS) 1 Year American Community Survey (ACS) 5 Year NCES | American Community Survey (ACS) 1 Year |
Table 2: Estimates of “Unconnected” State-by-State
| ESH | CSM | All4Ed | |
|---|---|---|---|
| National | 9.7 million students lack reliable internet connectivity at home | 15 million to 16 million students without an internet connection or device adequate for distance learning | 16.9 million children lack the home internet access necessary to support online learning |
| Texas | 1,159,221 | 1,828,917 | 2,104,514 |
| California | 1,298,944 | 1,528,536 | 1,763,038 |
| Florida | 658,723 | 800,519 | 859,018 |
| New York | 552,136 | 725,856 | 833,365 |
| Illinois | 403,474 | 588,917 | 635,855 |
| Georgia | 376,495 | 559,644 | 625,197 |
| Ohio | 277,046 | 500,187 | 579,779 |
| Michigan | 258,597 | 488,394 | 536,377 |
| North Carolina | 324,124 | 468,967 | 525,858 |
| Pennsylvania | 302,475 | 483,790 | 475,762 |
| Indiana | 186,630 | 363,995 | 438,365 |
| Tennessee | 217,405 | 363,553 | 434,739 |
| Arizona | 209,962 | 335,558 | 415,234 |
| Missouri | 160,330 | 333,212 | 394,745 |
| Virginia | 195,688 | 375,097 | 393,850 |
| Oklahoma | 151,347 | 285,444 | 345,997 |
| Alabama | 157,362 | 304,964 | 332,223 |
| Louisiana | 197,043 | 281,391 | 318,352 |
| Wisconsin | 125,317 | 268,021 | 297,324 |
| Arkansas | 105,490 | 225,207 | 296,639 |
| Mississippi | 124,085 | 234,207 | 290,739 |
| Kentucky | 176,843 | 240,673 | 286,447 |
| New Jersey | 179,513 | 312,444 | 284,879 |
| South Carolina | 159,681 | 265,652 | 283,081 |
| Washington | 163,624 | 249,702 | 280,297 |
| Minnesota | 107,283 | 249,845 | 264,334 |
| Colorado | 129,664 | 211,425 | 228,987 |
| Maryland | 137,266 | 213,600 | 220,714 |
| Oregon | 99,777 | 155,793 | 192,235 |
| Massachusetts | 149,624 | 204,325 | 185,053 |
| Iowa | 78,120 | 176,004 | 184,572 |
| Utah | 78,742 | 163,108 | 181,255 |
| Kansas | 82,111 | 156,518 | 171,750 |
| New Mexico | 82,356 | 133,623 | 151,279 |
| Nevada | 102,328 | 134,365 | 147,923 |
| Idaho | 44,766 | 101,325 | 110,504 |
| Connecticut | 81,945 | 121,776 | 110,176 |
| Nebraska | 50,764 | 95,834 | 107,141 |
| West Virginia | 71,800 | 92,323 | 96,684 |
| Montana | 22,654 | 48,758 | 57,569 |
| Alaska | 22,125 | 39,951 | 52,552 |
| Hawaii | 31,918 | 46,255 | 51,032 |
| South Dakota | 17,932 | 44,300 | 48,879 |
| Maine | 28,634 | 48,936 | 42,603 |
| North Dakota | 11,721 | 34,789 | 37,255 |
| New Hampshire | 17,408 | 35,855 | 36,507 |
| Delaware | 26,009 | 32,270 | 34,353 |
| Rhode Island | 22,940 | 37,787 | 32,396 |
| Wyoming | 11,880 | 30,244 | 29,683 |
| Vermont | 12,951 | 24,415 | 23,184 |
| District Of Columbia | 20,441 | 21,301 | 20,278 |
